Monthly Market Update · Data through June 2026
July 2026 San Francisco Market Outlook
Data Through June 2026
A monthly look at the data behind San Francisco buyer demand, pricing strength, inventory pressure, and what it means for buyers and sellers.
Ask Kris About the July Market UpdateEarlier this month, while paddling the crystal-clear waters of Meeks Bay, I had the space to reflect on San Francisco's equally unpredictable real estate market.
The latest market data reinforces that message: San Francisco's median single-family home price reached $2,128,000 in June, nearly 25% higher than one year ago.
But that does not mean every home increased 25% in value. The rise partly reflects the mix of properties sold, with larger and more expensive homes representing a greater share of transactions.
Chart 1
AI Boom Hits San Francisco Home Sales
The most intense competition is concentrated in San Francisco itself. In June, 44 homes in the city sold for at least $1 million over asking, with the total dollar volume above ask reaching roughly $60 million for the month.

In June, 44 transactions in San Francisco closed at least $1 million above the final ask price.
Chart 2
Wealth Effect Drives Home Purchase Demand
When equity markets climb, buyers feel wealthier and more willing to commit to a major purchase. That confidence is showing up clearly in San Francisco right now, where a surge in AI-driven wealth and a pipeline of upcoming IPOs is translating directly into housing demand at the top of the market.
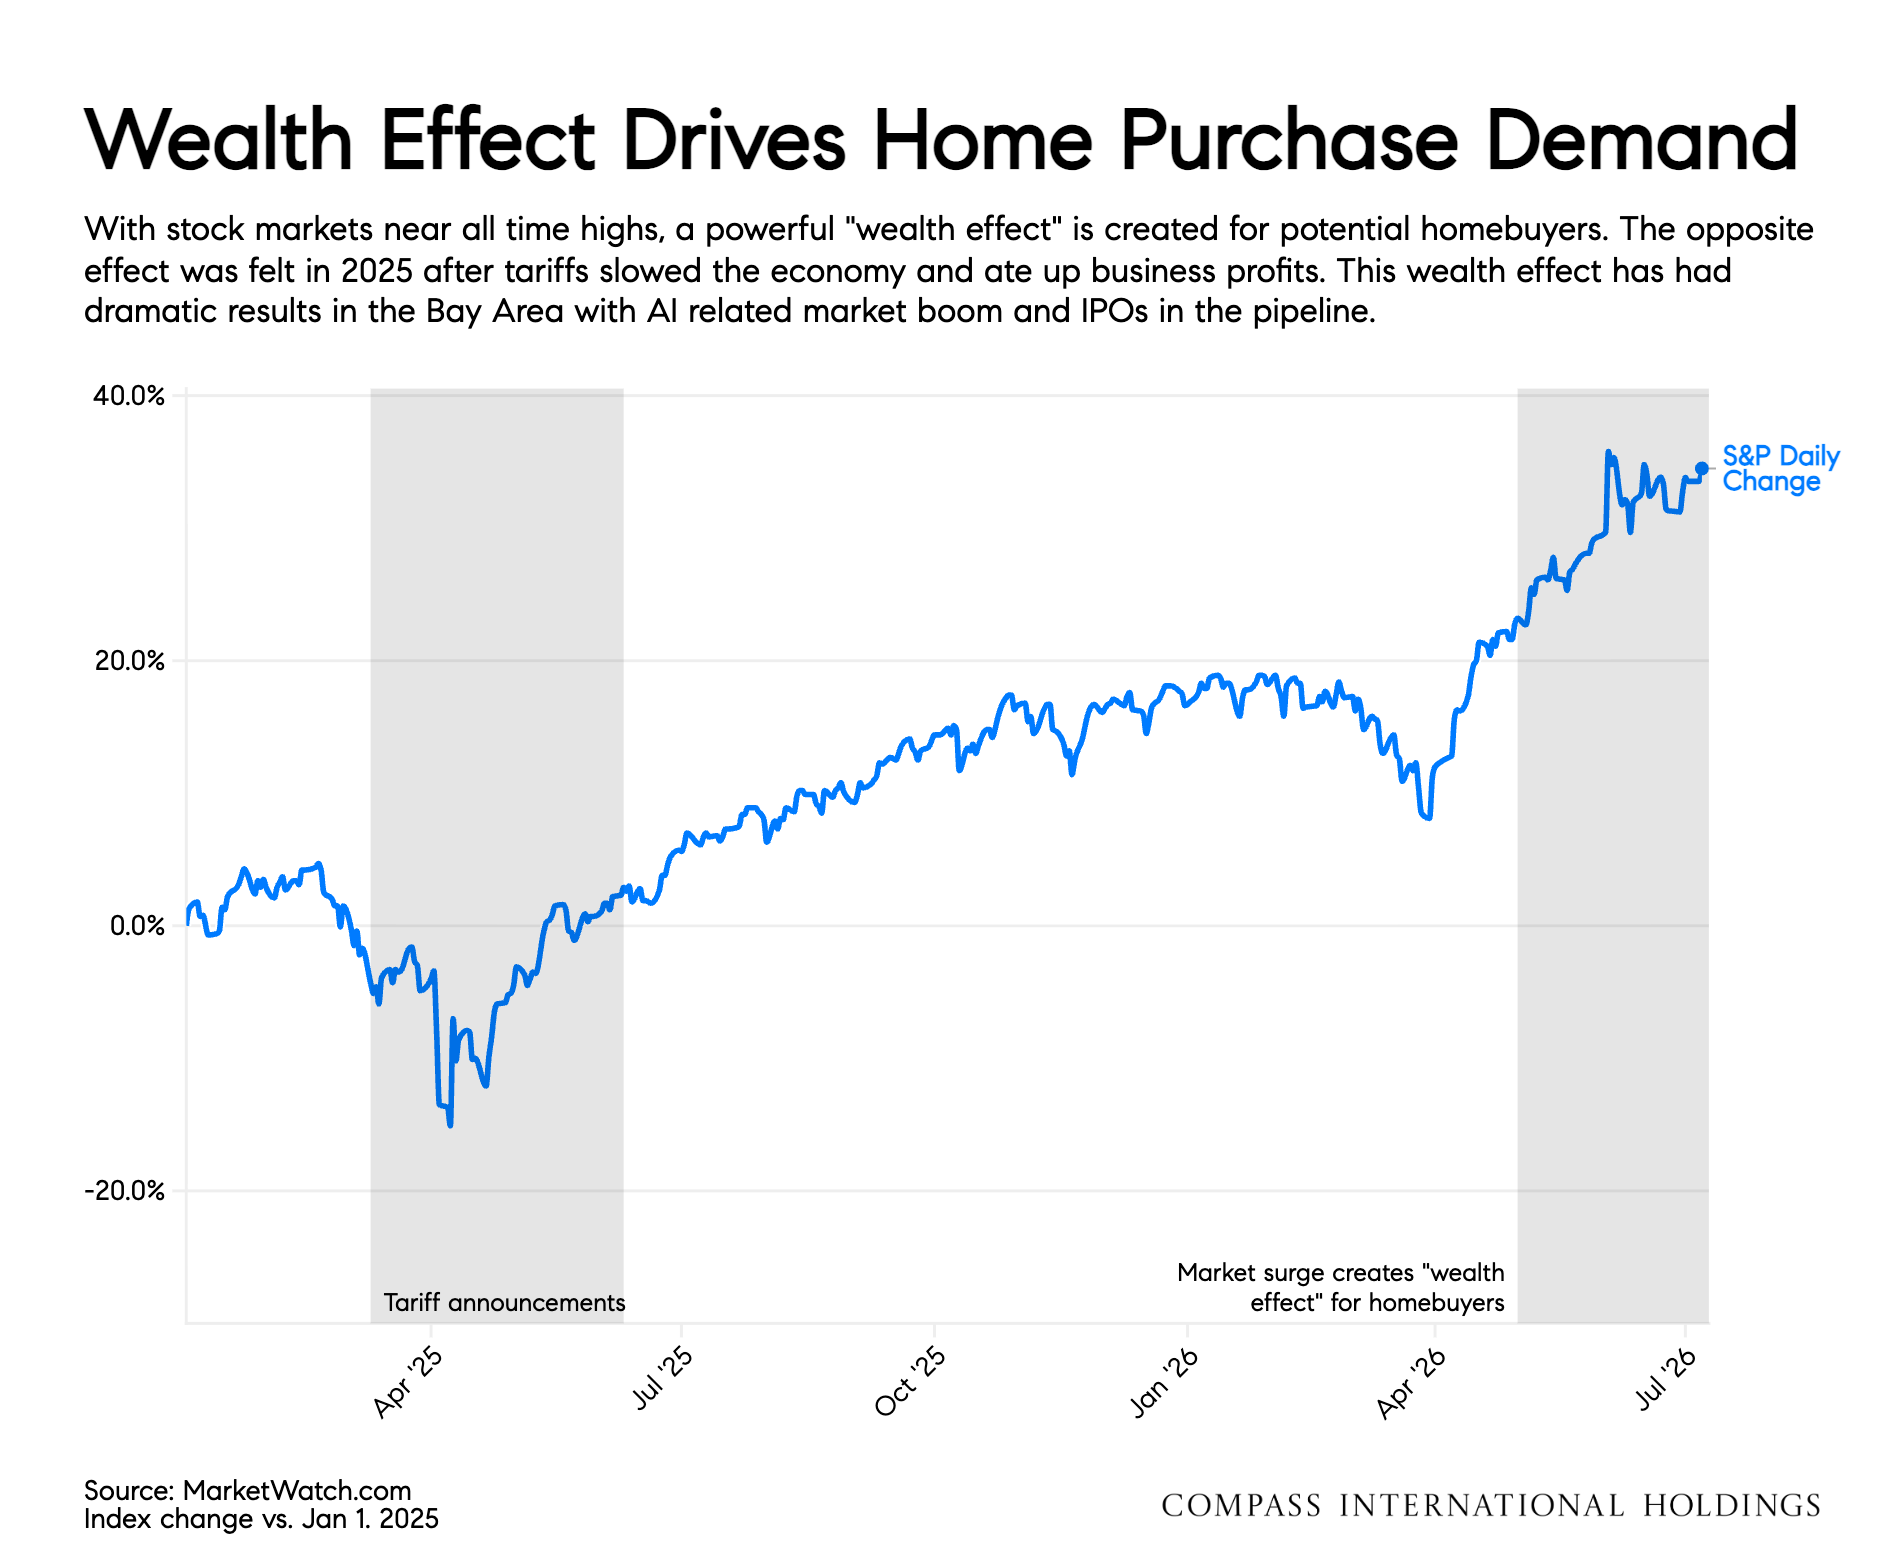
A stock-market wealth effect is fueling Bay Area home purchase demand, reversing the drag felt in 2025.
Chart 3
Bay Area Migration Sources & Destinations
For the first time in years, more households are moving into the Bay Area than leaving it. The shift is being driven by arrivals from other expensive tech hubs, even as a steady stream of residents continues to head toward more affordable regions.

Inbound migration to the Bay Area resumed in 2025, with Seattle contributing the largest net inflow to San Francisco.
Chart 4
Home Price Changes Over Time
Price trajectories have diverged sharply across Bay Area counties. San Francisco is pulling ahead with meaningful year-over-year gains, while several South Bay and coastal counties are still working through last year's pullback.

Median sales prices in Santa Clara have decreased 9.3% year over year, while San Francisco continues to appreciate.
Chart 5
Active Listings and Pending Sales
The gap between what's available and what's under contract has nearly closed. With so few homes sitting on the market, well-priced listings are moving into contract almost as fast as they come up for sale.

Available inventory has fallen to its lowest summer level since 2020, with a 92% absorption rate.
Market Snapshot
June Market Snapshot Preview
June's data shows a market with record pricing, exceptionally tight inventory, fast decision timelines, and demand concentrated in larger, higher-value homes.
$2,128,000
Median Sold Price
$1,230
Price per Sq Ft
21
Median DOM (Houses)
37
Median DOM (Condos)
590
Active Listings
546
Under Contract
92%
Absorption Rate
For Buyers
What This Means for Buyers
San Francisco remains competitive, but it is not one market moving at one speed. The important question is whether a particular home's location, condition, size, scarcity, and comparable sales support the price being considered. If you are watching the market, Kris can help you distinguish genuine scarcity from pricing strategy and identify where opportunities may still exist.
For Sellers
What This Means for Sellers
For sellers, the data tells a story of genuine scarcity. With inventory at its tightest summer level since 2020 and demand concentrated in larger, higher-value homes, well-positioned listings are moving quickly. The strongest result comes from pricing and preparation that generate confidence and competition.
Trying to understand what this market means for you?
Whether you are buying, selling, or simply watching the market, Kris can help you separate pricing strategy from real market value.